Operations dashboard · 2025
Fintech Customer Support Dashboard
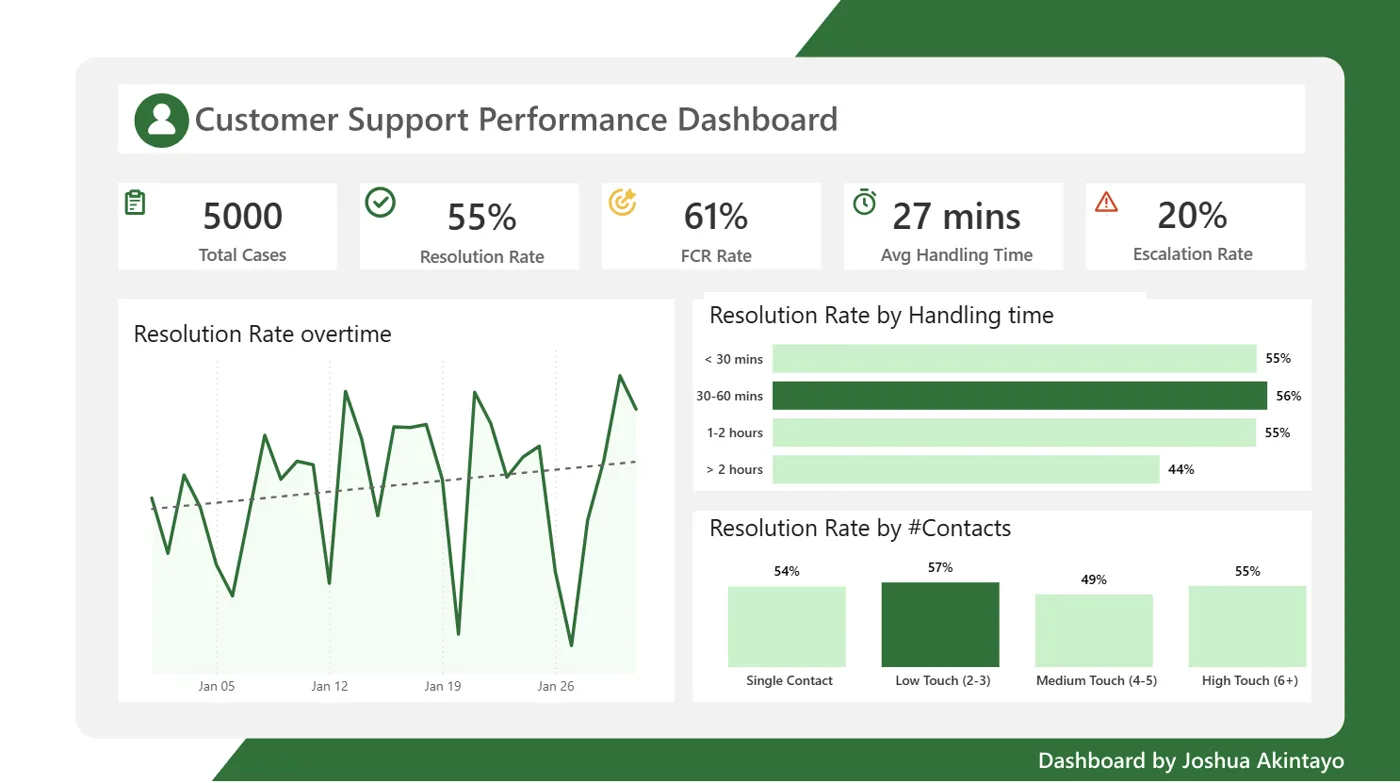
Real-time view of ticket volume, resolution and escalation rates, so support managers can spot bottlenecks and cut response times.
Power BIMicrosoft FabricDAX
Context
Fintech customer support operations were struggling to keep track of high volumes of tickets, leading to delayed responses and customer dissatisfaction.
The question
How can we monitor ticket volume and agent performance in real time to reduce response lag and improve operational efficiency?
Approach
- 1Connected to support platform APIs to stream ticket data into a unified reporting layer.
- 2Developed real-time DAX measures to calculate response lag and resolution rates dynamically.
- 3Designed interactive drill-down reports for managers to identify bottlenecks in specific support tiers.
Outcome
- Enabled operational teams to reduce response times by identifying peak load periods.
- Improved agent productivity tracking, leading to higher resolution rates across the department.